General utility functions
cu
-
tesfdmtools.utils.cu.cu(var)[source]¶ python3 keeps byte strings as type ‘byte’ (in python2 these strings were automatically converted into ASCII strings).
In the HDF5 files, the string attributes are all of type ‘byte’
In order to process these strings, they should be converted to ASCII using the decode(‘UTF-8’)
- Args:
var = any variable
- Returns:
converted variable, if variable was of type ‘bytes’, otherwise return variable
reventlist
-
tesfdmtools.utils.reventlist.reventlist(ifile)[source]¶ Read eventlist file (contains index, optimal filters fits, baseline and pulse-peak, and optionally rise and fall times ).
Eventlist files can be produced by ‘HDF_Eventpar’
- Args:
ifile = name of eventlist file
- Returns:
recn = list of record numbers of clean events in HDF5 file
ofit = list of optimal filter fits for events
base = list of baseline levels for events
peak = list of peak values for the event pulses
hdf = tuple containing parameters of the HDF file:
hdf[0] = full name of HDF5 file from which this eventlist is taken
hdf[1] = channel number from which the eventlist is taken
hdf[2] = frequency (pixel) number from wich the eventlist is taken
rtimes = rise times when present, otherwise None
ftimes = fall times when present, otherwise None
energies = fitted energies of the events when present, otherwise None
fiterrplot
-
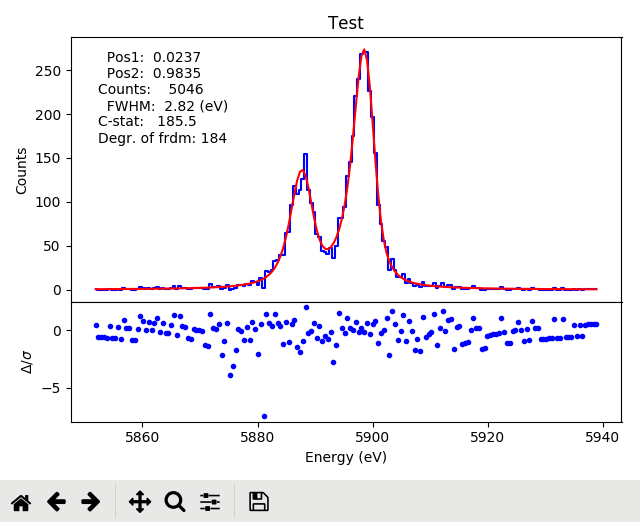
tesfdmtools.utils.fiterrplot.fiterrplot(x, y, yerr, fit, xtitle='X', ytitle='Y', ptitle='Plot', ptxt=None, pltax=None, sigrange=None, xcurve=None, ptxtsize=None)[source]¶ make a plot of data with the function fit, showing the errors in sigma
- Args:
x = x-coordinates for plot
y = y-coordinates of the data
yerr = 1-sigma errors of the data
fit = y-coordinates of the function fit to the data
- Kwargs:
xtitle = title for the X-axis [default ‘X’]
ytitle = title for the Y-axis [default ‘Y’]
ptitle = plot title [default ‘Plot’]
ptxt = text to appear in the plot (can be multiline with ‘n’) [default None]
pltax = plot instance for the plot. If None [default] generate plot instance.
sigrange = Y-axis range for sigma plot. When set, also plot Y-grid on integer Y values.
xcurve = an extra curve to be inserted in the plot
ptxtsize = size in pts for the fonts for ptxt. If None take default size
Below shows the layout of the fiterrplot plot for a fit of the Holzer function to Mn55 X-ray data. Top plot shows the data histogram (blue) with the function fit. Bottom plot shows the fit error in terms of sigma.
tesfdm_defaults
-
class
tesfdmtools.utils.tesfdm_defaults.Tesfdm_Defaults[source]¶ Define program-wide global defaults, stored in ${HOME}/.tesfdm_defaults
The defaults values are store in the __main__ namespace, as global values. This means that the default values will be identical for any Tesfdm_Defaults object within a script and its underlying modules.
-
get_filepath(ftype='')[source]¶ Get the filepath defaults value
- Kwargs:
ftype = filetype for which the defaultpath must be found
-
set_filepath(path, ftype='')[source]¶ Set the filepath defaults value. When a regular file is given, the path of the file will be stored as the filepath for the filetype of this file.
- Args:
path = path or file for which the default path will be set
- Kwargs:
ftype = filetype for which the defaultpath must be set. Only used when path is not a regular file.
-
readevents
-
tesfdmtools.utils.readevents.readevents(filename)[source]¶ Read processed and raw event fle and return datacolumns with the column names as listed in the event file
- Args:
filename = filename of the event file to read
- Returns:
header = dictionary of the file header containing the filename, channel and pixel
data = dictionary having the column names as keys which contain the data